This week we launched Instagram Hashtag Analytics. Hashtag analytics allows you to track brand or advertising campaign with certain hashtag.
Why hashtags are so important?
Hashtags attract more people to your content and increase engagement rate of your posts. Posts with hashtags get 50-70% more likes and comments. Also hashtags is a way of categorisation of content in social networks like Instagram and Twitter. Search engine inside of Instagram is based on hashtags so adding hashtags you are increasing discoverability of your posts.
Who needs hashtag analytics?
– Brands
– Advertising agencies
– Anybody who uses hashtags for their business
More 75% people on Instagram use hashtags. Tracking of hashtags allows you increase your performance and get more insight into your audience.
Which metrics of hashtag are the most important to track?
1. Count of public posts
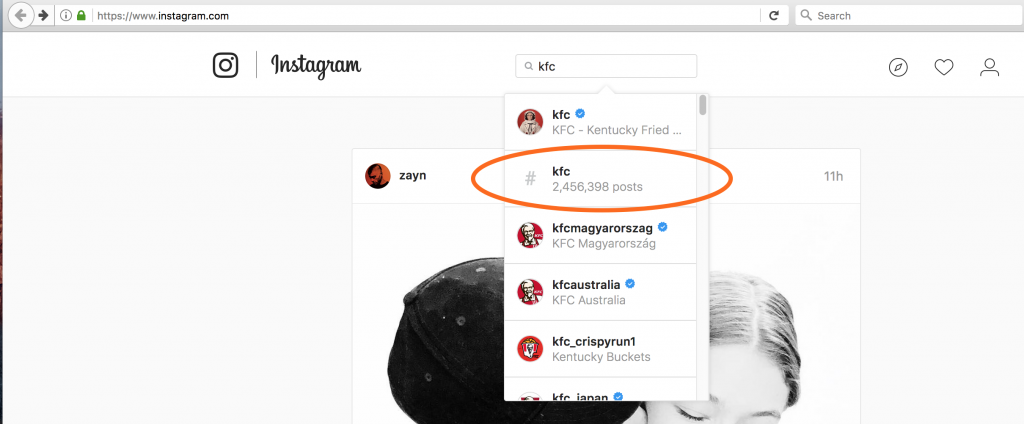
Count of public posts shows a dynamic of growth: more post means more impressions. But only count of public posts does matter. Posts on private accounts are hidden from anyone searching media by your hashtag (or associated hashtags). Instagram shows only total count of posts, including private and public posts:

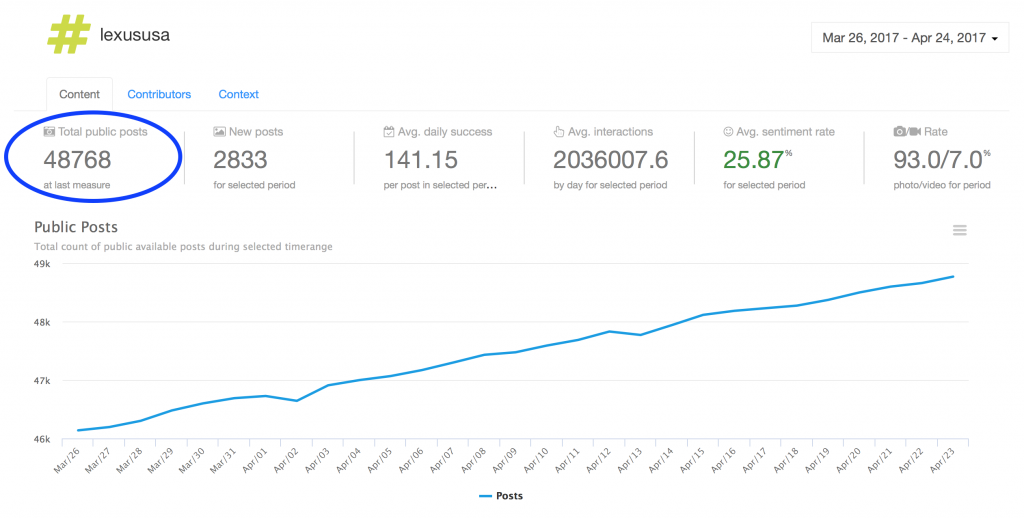
Hashtag Analytics tools like smartmetrics.co show you real count of public posts with dynamic of change:
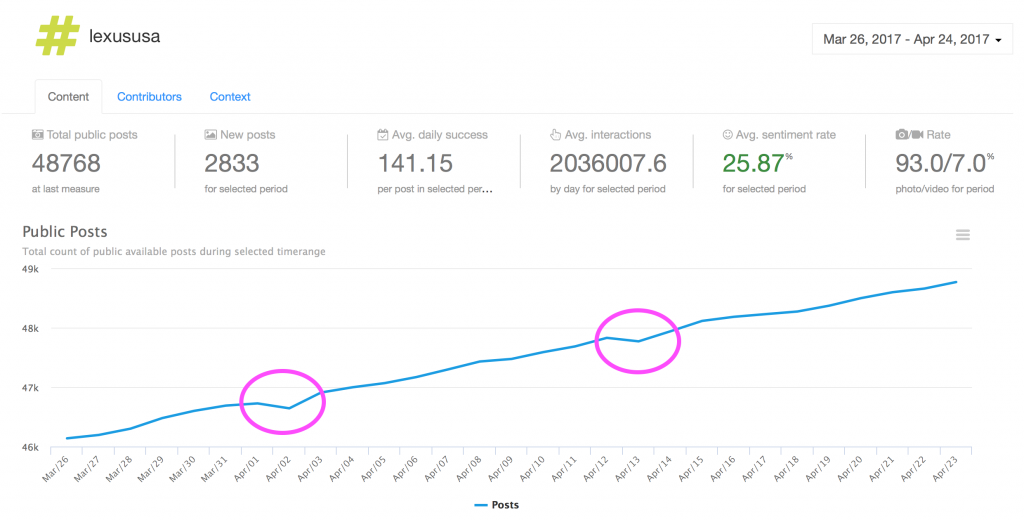
You can see that Instagram cares of content and removes spam bots and spam posts about once per two weeks:
2. Count of posts and their impression
Now it’s time to get detailed insights about your performance. You can find count of photo and video posts and impression of them (splitted by likes and comments).
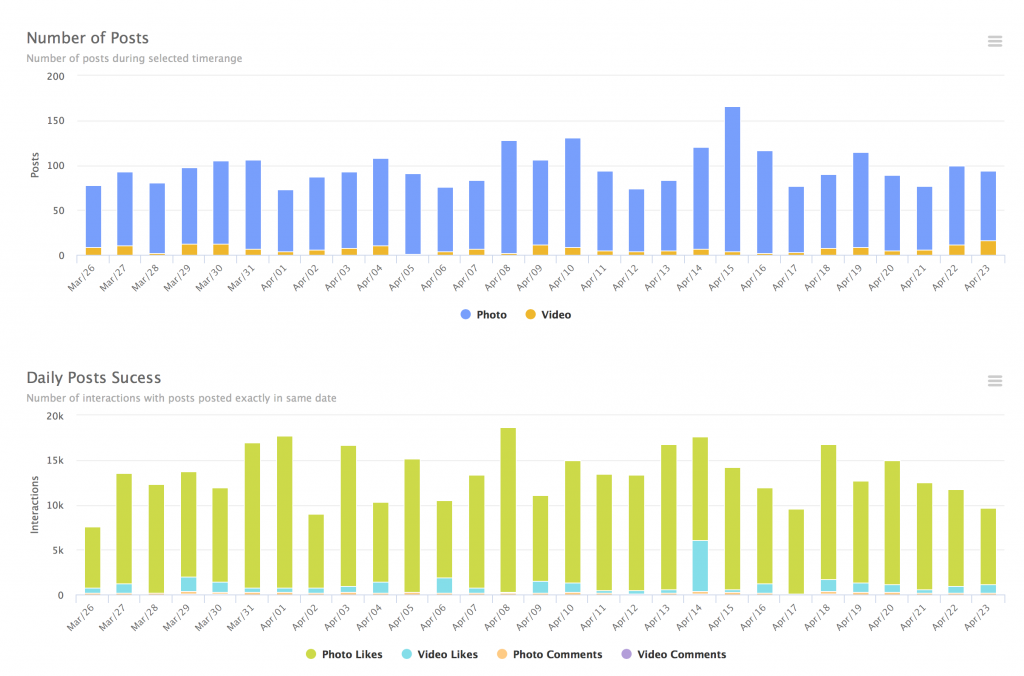
We have a representation of our performance but what is KPI metric for performance? We suggest to use average count of likes per post on your hashtag. It shows how audience interacts with your content.
We can see a chart with big splash щт April 1st (April Fools’ Day Jokes?):

3. Sentiment Rate
How people feels about your brand? Smartmetrics uses AI and machine learning technologies to analyse text and determine emotional reaction.

Positive average sentiment rate means that people are happy with your brand.
4. Picture processing and filters
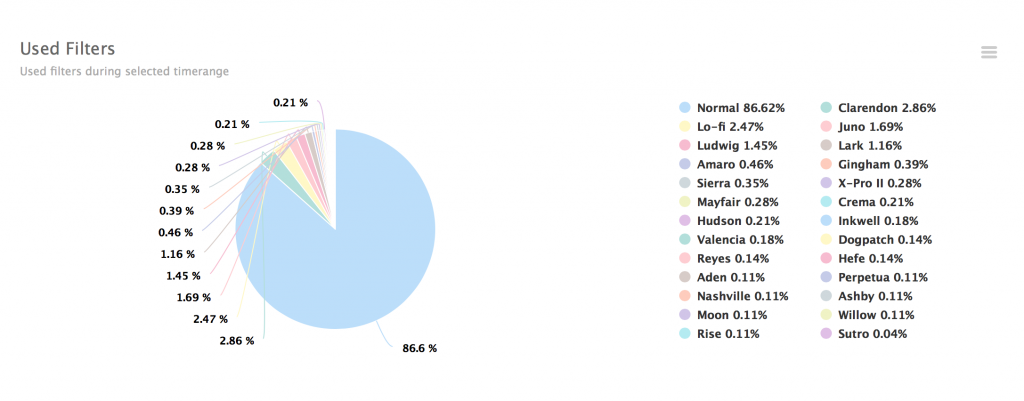
Using Normal images (no filter) represents that people like how picture looks. Also people not use filters for pictures made with professional camera and processed on computer.
5. Top posts
Easy way to find the most popular posts. Looking at most liked posts for selected period you can understand, for example, what product of your brand or what part of some event was most interesting. Reading comments to the most commented posts you can get live feedback.
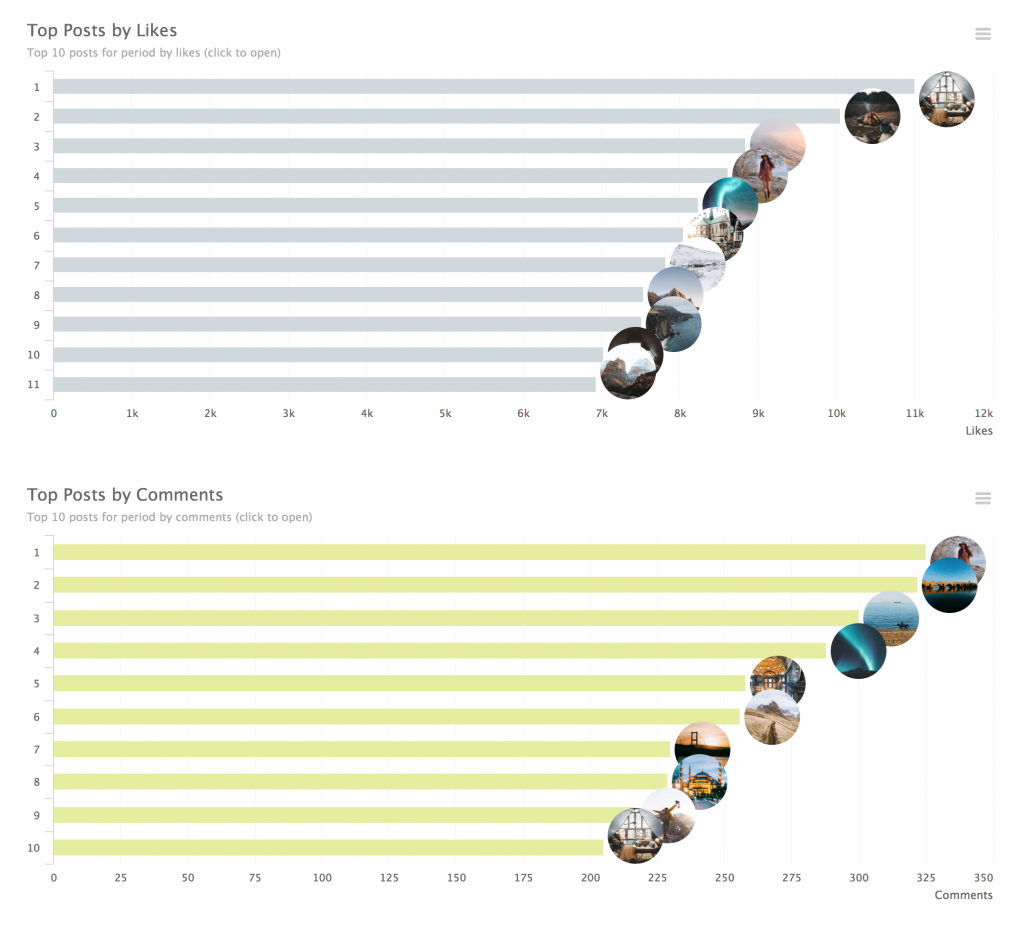
Just click on the preview picture and page with post on Instagram will be opened in your browser. Read comments and communicate with your audience.
6. Community size around your brand
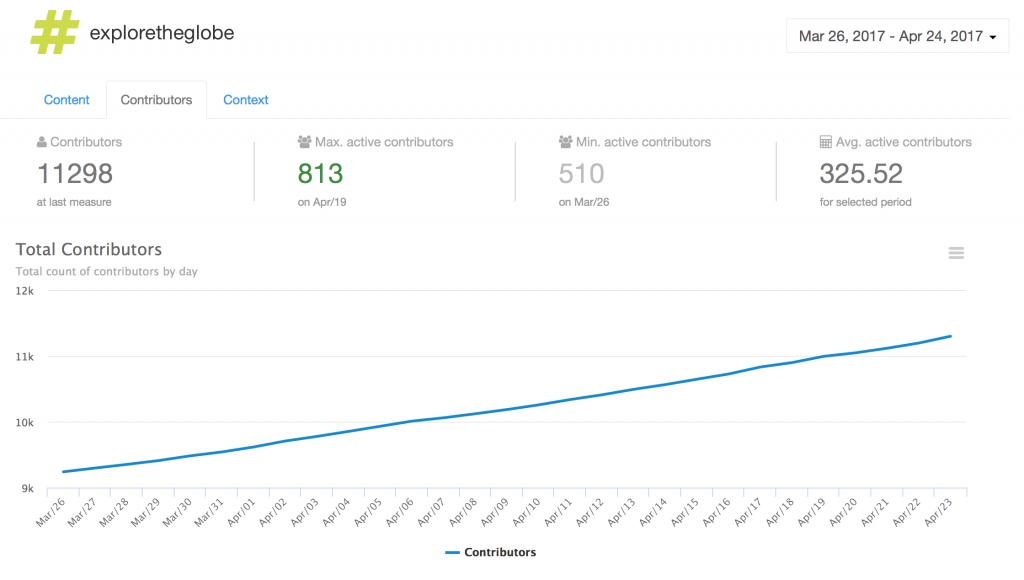
This chart represents the growth of your community and shows people contributed to your hashtag ever.
7. Activity of contributors
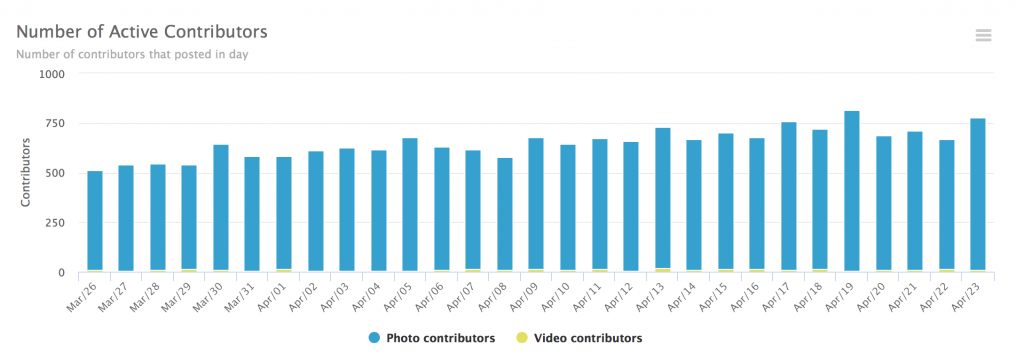
How many people posted photo or video day by day. This bar chart shows real size of active community around your brand.
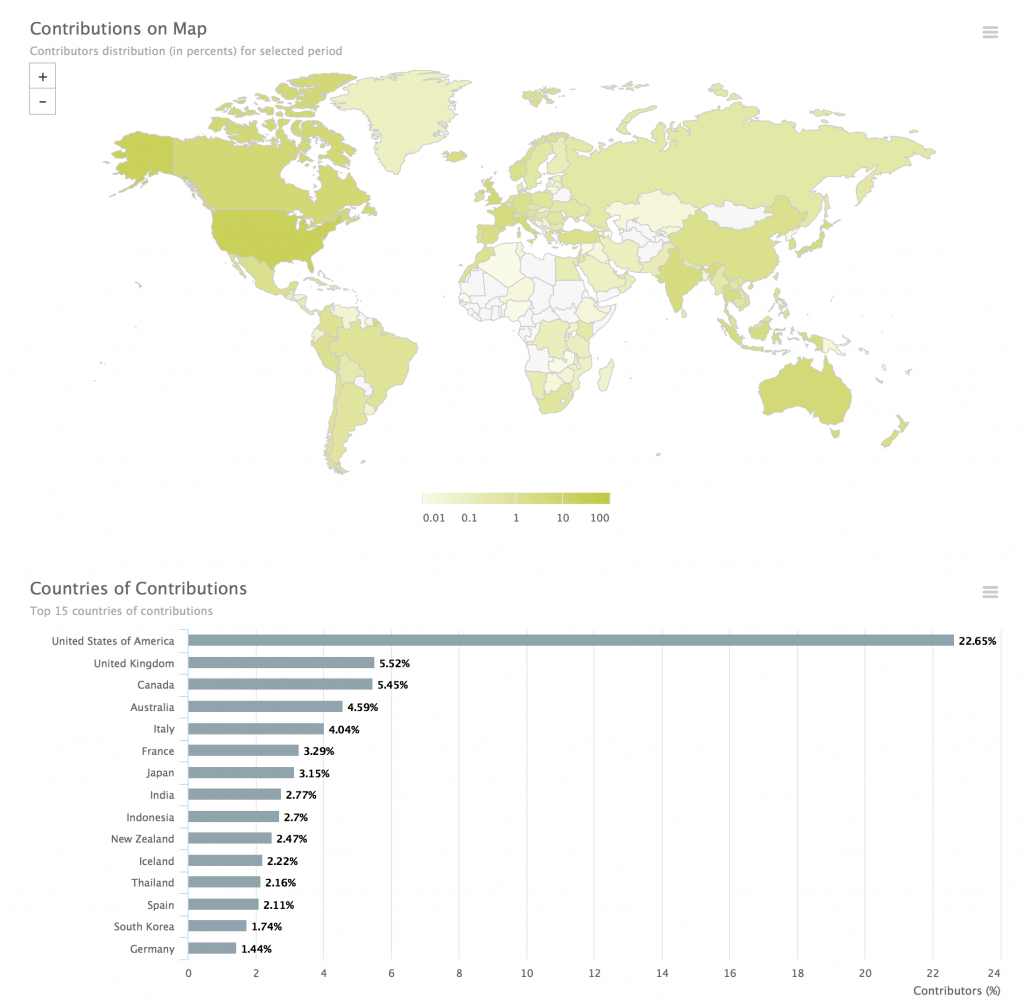
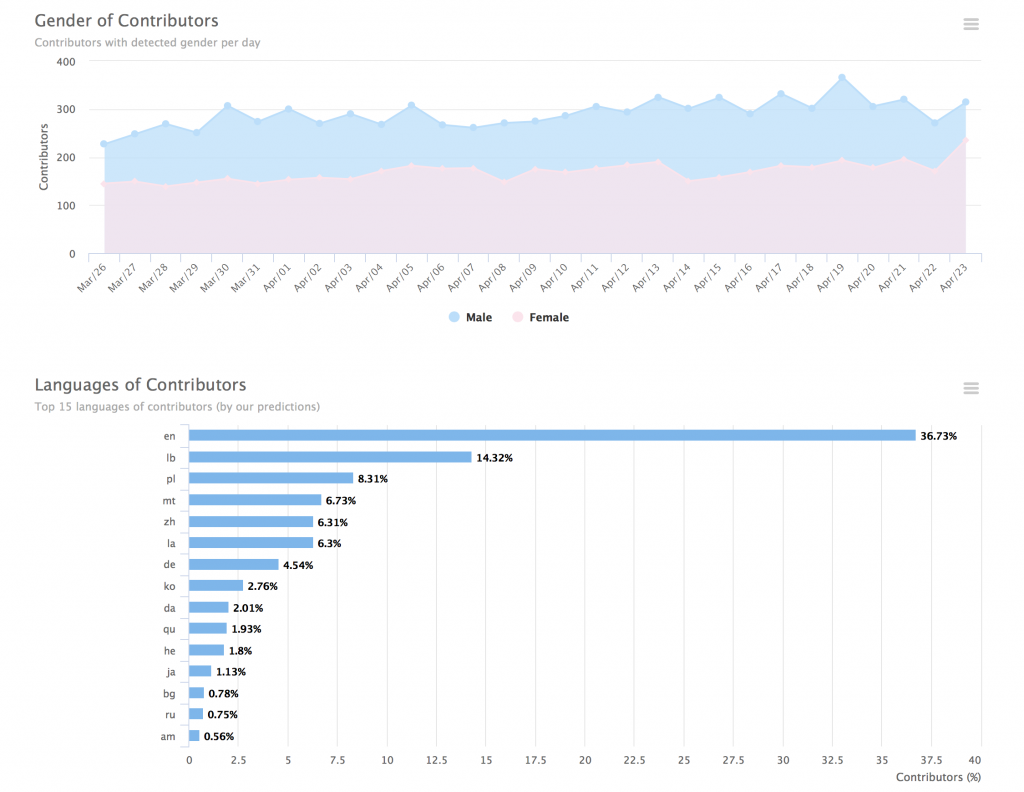
8. Geo distribution, demography and languages
This data allow you to choose proper content for your brand audience. Very important to track. You can improve content not only for hashtag but for account too. This analytical data become especially powerful with enabled account tracking.
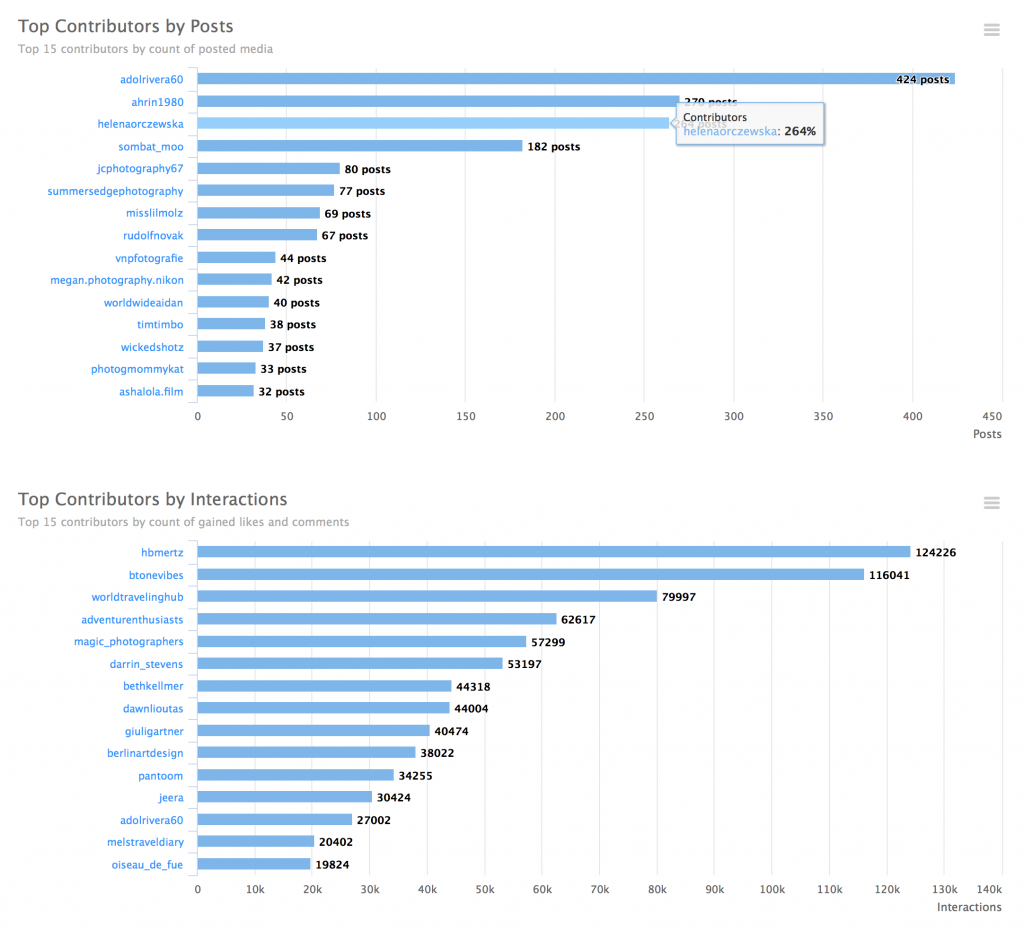
9. Top contributors by post count and impressions
They are a core of your audience. Track active contributors and encourage them. Also data about active contributors can be useful at events or quizzes, just filter data by necessary period of time.
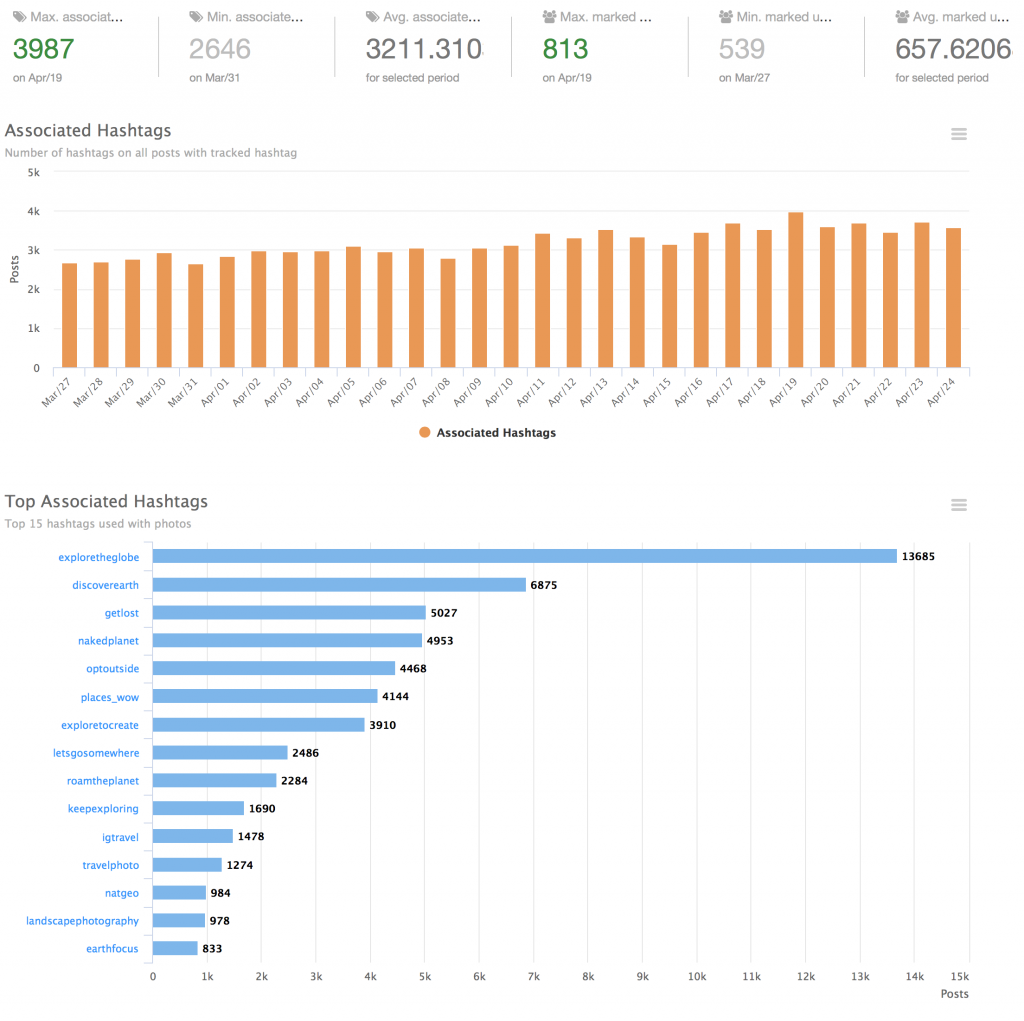
10. Associated Instagram hashtags
By analysing associated hashtags you can improve discoverability of your posts. You also track top associated hashtags and extend brand audience.
We reviewed only 10 most important metrics but Smartmetrics.co provides 20+ metrics for full control of your hashtag. Track it, analyse it and make your campaigns better! We wish you the best social presence!